Q.1.
In the following pie chart, which has the largest percentage?
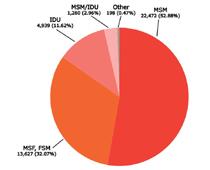
-
100%
MSM
-
0%
MSF
-
0%
IDU
-
0%
Other
Q.2.
This is an example of which type of chart?

-
50%
Line graph
-
50%
Histogram
-
0%
Bar chart
-
0%
Pie chart
Q.3.
Using this pie chart, showing the composition of the human body, which of the following is the body mainly made of?
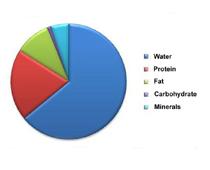
-
0%
Protein
-
0%
Fat
-
0%
Carbohydrate
-
100%
Water
Q.4.
Looking at this histogram of the height of cherry trees, why is this a histogram and not a bar chart?
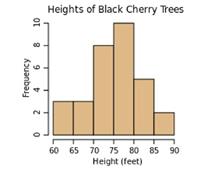
-
0%
Height is continuous data
-
0%
Height is discontinuous data
-
0%
The data is averaged
-
100%
The data is accurate
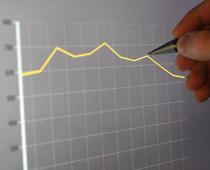
Q.5.
Looking at this line graph covering a 12-hour period, which hour shows the highest amount?
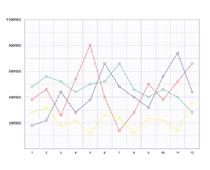
-
100%
3
-
0%
5
-
0%
7
-
0%
11
Q.6.
Identify this type of chart.
-
0%
Line graph
-
100%
Bar chart
-
0%
Histogram
-
0%
Scatter graph
Q.7.
This chart is a type of...

-
0%
bar chart
-
100%
line graph
-
0%
mean
-
0%
data
Q.8.
What sort of chart is this?

-
100%
Pie chart
-
0%
Line graph
-
0%
Bar chart
-
0%
Scatter graph
Q.9.
This shows the population of a country as time goes on. The population is...

-
0%
increasing
-
100%
decreasing
-
0%
the same
-
0%
increasing and decreasing
Q.10.
Points just plotted without joining or bars is known as a ...

-
0%
scatter graph
-
100%
line graph
-
0%
pie chart
-
0%
bar chart